Nano Acoustics
Relating to work conducted from 2006 to 2008
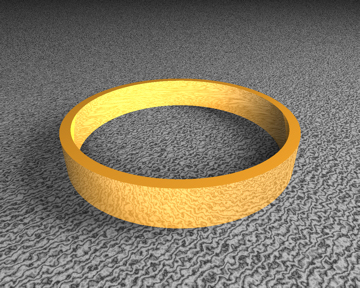 The science of acoustics is that of pressure waves and vibrations. When we listen to a sound it is the variation in the air, expanding and contracting, that we actually hear. While we have no trouble hearing conversations within the room, air is quite a poor conductor of sound, and so we cannot hear people chatting in the neighbouring town. The reason for this is that each molecule in the air must move and bump into another molecule to transmit the signal, air is quite thin so this process is not very efficient. Water is much denser, and so sounds can carry much further, whales for example can communicate to others up to 800 Km away. When considering the acoustics of solids, we are interested in the propagation of the pressure wave within the medium. At the small-scale things work much the same as at the larger scale, although there are certain differences. As a first example, a gold ring placed on a glass surface is considered, as shown in the picture. The ring is 120 nm in diameter so is quite small. If we are to understand the acoustic properties of this system, we cannot just hit it and try to listen to the sound, it is too small so the noise is very high pitch and incredibly quiet. So, to investigate this system we use an ultra-fast laser technique. The laser of choice has a pulse length of 100 femto seconds, or 100e-15 seconds. To put in context there are as many femto seconds in one second as there are seconds in 30 million years. The reason we need such a short pulse is that at the 100 nm scale things move fast and so to be able to record these signals with a high fidelity we need something very fast, in the same way a fast shutter speed is needed for taking photos of moving objects.
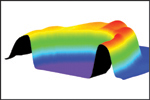
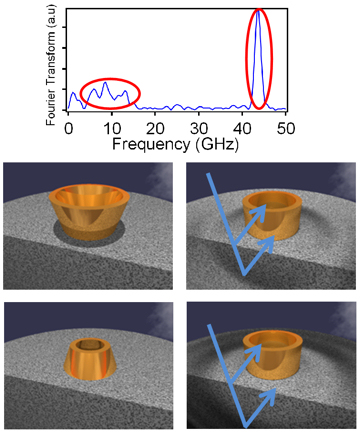 If we now consider what happens when this pulse reaches the ring, we can imagine that the light that is incident on the glass around the ring will simply be transmitted. Much of the light hitting the ring itself will be reflected; however, a small amount will be absorbed. Since the pulse of light is short it has a very high power for that short period of time. The small amount of absorbed light goes into exciting electrons in the gold and since the ring is also very small, the overall effect is quite large. In fact, the electrons can reach hundreds of degrees before they collide with gold atoms, causing a small heating of the whole ring. As the ring is heated it expands rapidly. This heating is also very fast, but with no sustained energy the metal quickly starts to cool again, and now the ring will oscillate due to the impulsive excitation of the light. Another effect from this process is that when the metal is heated it will create a pressure wave both into the material and along the surface, as shown in the top figure. Hence in essence the pulse of light has acted like a hammer hitting the ring and making the system vibrate.
To detect a signal from the oscillations of the ring and surface we require another pulse of light, and this time some extra tricks must be played. First, we use a different colour to the pump pulse so the excitation light does not interfere with the measurement. Then we reflect the probe light into a detector and use clever electronics to measure tiny variations in the intensity, this is important as the actual reason for the change in reflectivity can be either from slight changes in material properties, or slight changes in shape leading to less light being reflected back to the detector, both lead to only very tiny changes in reflected signal. The probe light is also passed along a line where the mirror at one end can be moved. As this mirror is moved, the relative time between the pump and probe pulses can be changed, and since light moves very fast a small change in the mirror position corresponds to a very small change in time between the pulses, however this is exactly what we want to measure very fast oscillations. Thus, we can detect tiny differences in the amount of probe light on time scales down to that of the pulse length. The next trick is that after a time trace is recorded, a Fourier transform is taken. Fourier transforms are very useful in physics and convert a signal in time into a trace showing the amount of energy at every frequency present. One such trace is shown in the second figure. Here we can see two main features, circled in red. The low frequency peak corresponds to the ring oscillating, as shown pictorially underneath. The higher frequency peak corresponds to light bouncing off the pressure wave that was launched into the glass. As the pressure wave moves the light reflected off it changes its phase with that reflected off the top surface. This causes interference, and produces a strong observable signal. While of limited interest to us here, this signal is useful for characterising the material properties.
 Finally, it is of interest to note that there are three peaks visible in the data corresponding to the ring oscillation. By performing a theoretical simulation of the structure oscillations at similar frequencies can be found, and so we understand that the ring motion, with the sides flexing, bending and oscillating in a complex fashion.
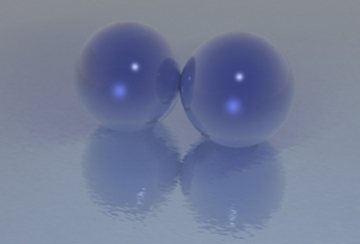
The same technique described above can be applied to many different situations. Another is looking at micro spheres arranged in lines. The top of one sphere can be excited using the pump laser pulse which sets up waves travelling around the sphere, these can then be recorded and analysed. If the spheres are touching one other, then some of the vibrational energy will be coupled to the second sphere, which can then also be measured. In so doing, it is possible to understand better the coupling between the spheres at the small scale.
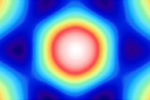
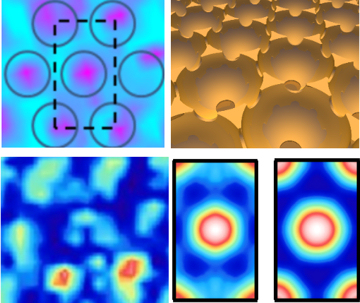 In the next level of complexity, it is possible to move a sample relative to the pump and probe laser spots, and hence map the phonon response at different points on a surface. Using a piezoelectric stage, the sample position can be controlled to tens of nanometres, and so the resonances of nanostructures can be mapped down to the diffraction limit of the probe light, of order 300 nm. The nano-dish samples investigated previously was again used, and in this case the dish diameter is chosen to be 1200 nanometres. The geometry is shown in the figure, top right, with a honeycomb of dish shapes covering the surface. The figure also shows the reflectivity at each point on the surface, top left. This is working at the diffraction limit of light and so represents the best possible visualisation of this nano-structured surface. This is why the image is quite grainy but the positions of the dishes are clearly visible.
As well as monitoring the reflected light, at each point a time trace is recorded after the pump laser pulse has excited phonons in the structure. Here the plasmonic nature of the surface helps to couple the optical light into the structure. The time trace can be Fourier transformed to form a frequency spectrum at each point on the geometry. It is found that there is a strong resonance at 0.7 GHz, the energy at this frequency is shown at each surface point; bottom left of the figure. Due to sample and detection imperfections this data looks a little random, however since we know the surface to be 6-fold symmetric we can first overlay the unit cells of a number of voids in the image to form a single smaller average image. We can then average over all 6 symmetry directions to average the whole image into a single sub-region of a void. This is then rotated 6 times to form the fully spatially average data; image bottom right shows 2 resonance modes of the surface. This procedure is pushing the limit of data analysis and so many tests have been done to ensure it produces reasonable results. From these images we can see that the resonance energy of the surface is located at the centre of the voids, this work is also backed up with simulations that verify this concentration of acoustic energy at the centre of the void.
Hence it has been shown that the use of ultra-fast laser techniques coupled with precise experiments and thorough data analysis and simulations, it is possible to fully understand the acoustic nature of nano structures and surfaces.
Papers relating to this work:
 Mapping gigahertz vibrations in a plasmonic-phononic crystal
T.A. Kelf, W. Hoshii, P.H. Otsuka, H. Sakuma, I.A. Veres, R.M. Cole, S. Mahajan, J.J. Baumberg, M. Tomoda, O. Matsuda, and O.B. Wright.
New J. Phys. 15, 023013 (2013)
 Ultrafast Vibrations of Gold Nanorings
T.A. Kelf, Y. Tanaka, O. Matsuda, E.M. Larsson, D.S. Sutherland and O.B. Wright.
Nano Lett.11, 3893-3898 (2011)
 Vibrations of microspheres probed with ultrashort optical pulses
T. Dehoux, T.A. Kelf, M. Tomoda, O. Matsuda, O.B. Wright, K. Ueno, Y. Nishijima, S. Juodkazis, H. Misawa, V. Tournat, and V.E. Gusev
Optics Lett. 34, 3740-3742 (2009)